Obtaining the globally averaged temperature from weather station data has a well-known problem: there are some gaps in the data, especially in the polar regions and in parts of Africa. As long as the regions not covered warm up like the rest of the world, that does not change the global temperature curve.
But errors in global temperature trends arise if these areas evolve differently from the global mean. That’s been the case over the last 15 years in the Arctic, which has warmed exceptionally fast, as shown by satellite and reanalysis data and by the massive sea ice loss there. This problem was analysed for the first time by Rasmus in 2008 at RealClimate, and it was later confirmed by other authors in the scientific literature.
The “Arctic hole” is the main reason for the difference between the NASA GISS data and the other two data sets of near-surface temperature, HadCRUT and NOAA. I have always preferred the GISS data because NASA fills the data gaps by interpolation from the edges, which is certainly better than not filling them at all.
(...)
The surprising result
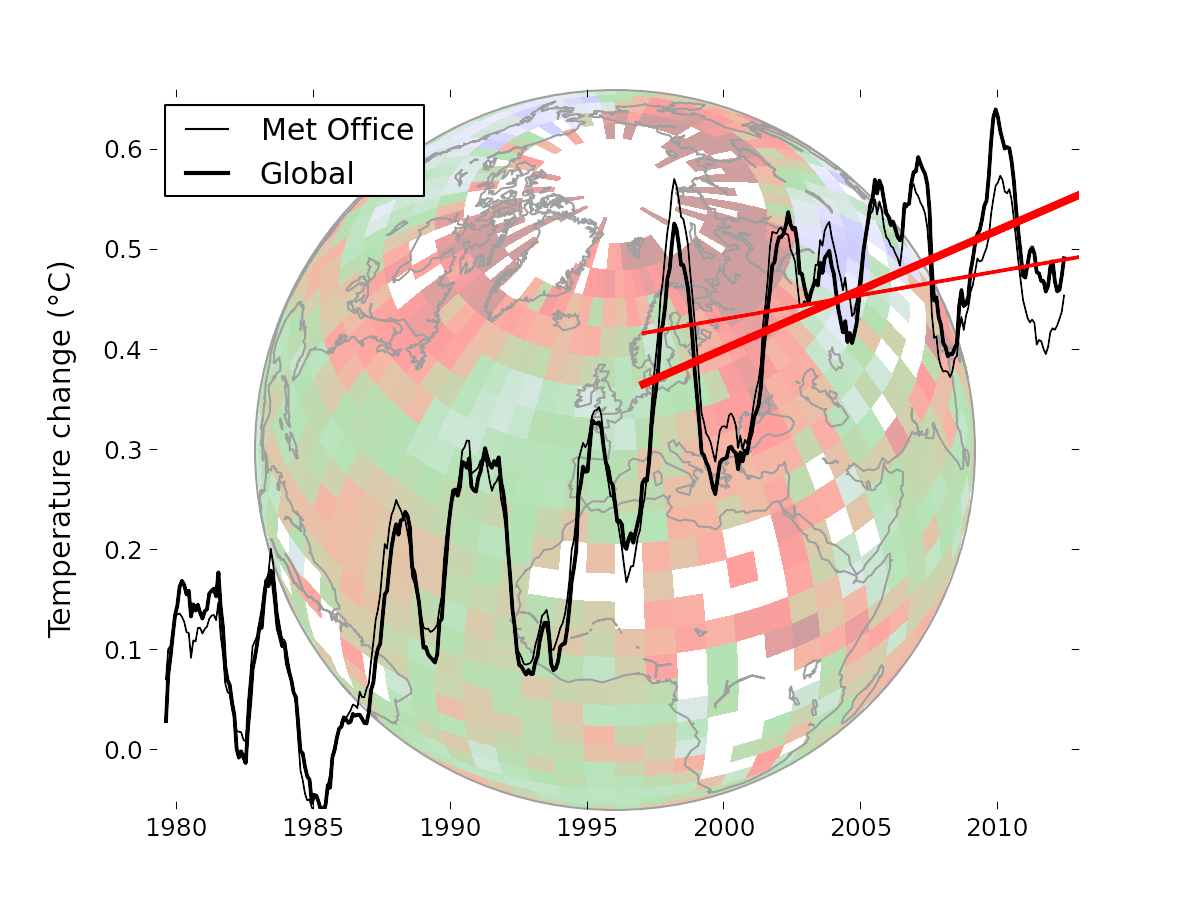
Cowtan and Way apply their method to the HadCRUT4 data, which are state-of-the-art except for their treatment of data gaps. For 1997-2012 these data show a relatively small warming trend of only 0.05 °C per decade – which has often been misleadingly called a “warming pause”. The new IPCC report writes:
Due to natural variability, trends based on short records are very sensitive to the beginning and end dates and do not in general reflect long-term climate trends. As one example, the rate of warming over the past 15 years (1998–2012; 0.05 [–0.05 to +0.15] °C per decade), which begins with a strong El Niño, is smaller than the rate calculated since 1951 (1951–2012; 0.12 [0.08 to 0.14] °C per decade).But after filling the data gaps this trend is 0.12 °C per decade and thus exactly equal to the long-term trend mentioned by the IPCC.
Conclusion
The authors write in their introduction:
While short term trends are generally treated with a suitable level of caution by specialists in the field, they feature significantly in the public discourse on climate change.
Read more/Leia mais on/em realclimate
Nenhum comentário:
Postar um comentário