Sea leave rise reveals a lot about our changing climate. A rise in the mean sea level can be caused by decreases in ocean density, mostly reflecting an increase in ocean temperature — this is steric sea level rise. It can also be caused by an increase in ocean mass, reflecting a gain of fresh water from land. A third, and smaller, contribution to mean sea level is from glacial isostatic adjustment. The contribution of glacial isostatic adjustment, while small, has a range of possible values and can be a significant source of uncertainty in sea level budgets. Over recent decades, very roughly half of the observed mean sea level rise is owing to changes in ocean density with the other half owing to the increased in ocean mass, mostly from melting glaciers and polar ice sheets. The exact proportion has been difficult to pin down with great certainty.
Knowing the proportion of sea level rise (SLR) owing to mass addition versus thermal expansion is not only important for quantifying total SLR. Each component also imparts information about the effects of climate change. First, the ocean absorbs over 90% of the excess heat from greenhouse gas forcing. In order to monitor and model global warming accurately, we need to know where and how much heat is entering the ocean, and which is directly (although nonlinearly) related to steric SLR. Sea level rise is an important consequence of climate change, and quantifying rates of melting of land ice, including contributions from the massive Greenland and West Antarctica ice sheets is vital to understanding sea level rise. Knowing local rates of past SLR and what is driving those rates will help to improve global and local projections of SLR that are essential for informing adaptation strategies in coastal communities.
Over the past two decades, revolutionary advances in the global ocean observing system have made it possible to estimate the relative contributions of mass and thermal expansion with increasing certainty. Since 1992 satellite altimetry has provided high-resolution measurements of sea surface height. These data are used to estimate local and global sea level variations. Since 2002, monthly large-scale variations in ocean mass have been estimated using data from the Gravity Recovery And Climate Experiment (GRACE), twin orbiting satellites capable of measuring very small changes in Earth’s gravitational field. GRACE data can be used to estimate variations in ocean mass either by measuring changes in gravity over the ocean or by measuring glacial retreat, melting of polar ice sheets, and changes in terrestrial reservoir storage. Finally, starting around 2005 the international Argo Program’s array of autonomous profiling floats first achieved sparse near-global coverage, allowing estimates of steric sea level changes in the upper half of the ocean using in situ measurements of ocean temperature and salinity. Thus, since around 2005, satellite and in situ observation systems have allowed for direct estimates of the total change in SLR, that owing to changes in ocean mass, and that owing to temperature (and to a lesser extent salinity) changes in the upper half of the ocean volume.
With these revolutionary developments in ocean observation, many researchers have been asking some obvious, but very important, questions. Does the total sea level change equal the sum of heating and mass changes within estimated instrumental error? If not, which measurement systems might be biased or incomplete? Is neglect of a deep steric contribution preventing the budget from closing?
In situ data deeper than the current 2000 m Argo sampling limit are the best way to address some of these questions. In the 1990s, for these purposes and others, international investigators working on the World Ocean Circulation Experiment (GO-SHIP) began to repeat a subset of these sections at decadal intervals. With the first decadal re-survey recently completed, we have investigated changes in deep ocean temperature and salinity in the bottom half of the ocean volume, around the globe between the 1990s and the 2000s. In our most their paper, we combine these full depth measurements of ocean steric changes with satellite sea-surface height data to evaluate the SLR budget, including any deep steric expansion, and make an estimate of the global ocean mass changes independent of GRACE data.
First, we interpolate satellite sea surface height data to the times and locations of these repeat sections to look at the total sea-surface height changes between repeats. We then calculate the difference of this total sea-level change and the full-depth steric changes from the repeat section salinity and temperature data. The result is the change in ocean mass between section occupations. Despite the very limited spatial coverage compared to Argo (Fig. 1), this method allows for statistically significant global average and seven regional averages of ocean mass trends because ocean mass variations in most ocean regions are comparatively large in spatial scale since small-scale mass fluctuations are very quickly evened out by ocean surface gravity waves. Most small-scale variability in local sea level is related to steric changes that are captured in the steric SLR integration and removed from the total. Globally, our mass trend estimate, centered on 1996–2006, is 1.5 mm per year, with large spatial variability.
Our GRACE estimate of SLR trend (from an averaging kernel) is also 1.5 mm per year for 2003–2013, although this method may produce a slight underestimate of the actual trend. Nonetheless, the results from the two independent methods agree well within their uncertainties (both 0.4 mm per year), despite the fact that these two different decadal estimates only have 3 years of overlap. Furthermore, the spatial variability among the seven regions also shows good agreement, with most falling within error bars of each other.
Both methods find that the South Atlantic and North Pacific are gaining mass the fastest, while the North Atlantic and Pacific sector of the Southern Ocean are either gaining little or no mass (Fig. 1). This regional variability in ocean mass trends can be attributed to a number of factors. In the North Pacific, the more rapid ocean mass addition has been attributed to large-scale changes in wind patterns over the ocean that affects the wind driven ocean circulation. These circulation changes will be reflected in sea surface topography, which is in part a reflection of shifts of mass from one region to another. The relatively large mass gain in the South Atlantic is most likely also attributed to local changes in wind stress, possible affecting the Weddell Gyre or the Antarctic Circumpolar Current. The two regions with the smallest rates of mass increase are adjacent to Greenland or West Antarctica. These ice sheets are losing mass due to melt, thus losing some of their gravitational attraction, and causing an observable local decrease in sea level there as these waters are redistributed elsewhere.
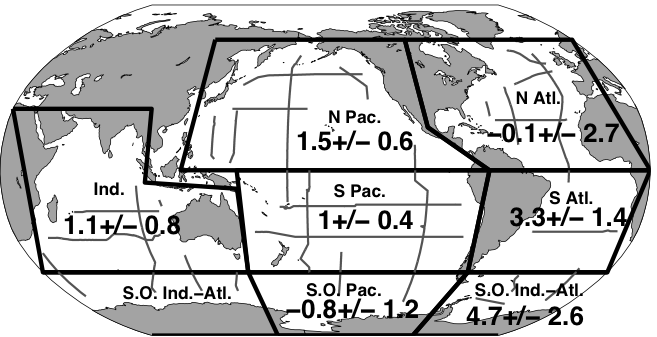
Figure 1: Mean ocean mass sea level rise (mm per year) in within each boundary (black lines) calculated using all full depth data available (gray lines). From their paper.
Because we are using full-depth steric data, we can estimate the contribution of deep ocean warming (hence expansion) to the sea level rise. If deep-ocean warming below 2000 m is ignored, it introduces 13% error into the estimate of the global ocean mass trend. Furthermore, if ocean warming below 1000 m is ignored, the ocean mass trend estimate using our method no longer agrees with that from GRACE within error bars.
This work highlights the importance of the deep ocean warming contribution to SLR. At the moment, the best direct estimates of these changes are using the spatially and temporally sparse but high quality and full-depth WOCE and GO-SHIP data sets to get basin-scale and global trends over decadal time-scales. To estimate regional evolution of deep-ocean warming and its contribution to SLR over shorter space and time scales requires an improved deep monitoring system. Currently, prototype profiling floats capable of measuring temperature and salinity all the way to 6000 m are being tested for a Deep Argo array (Figure 2). If enough of these floats are deployed, this new Deep Argo array, capable of measuring all but about 2% of the entire ocean volume, together with the current 0–2000 m Argo array, would allow for continuous monitoring of full-depth ocean heat uptake and hence steric sea level rise, both regionally and globally.
References
1. S.G. Purkey, G.C. Johnson, and D.P. Chambers, "Relative contributions of ocean mass and deep steric changes to sea level rise between 1993 and 2013", Journal of Geophysical Research: Oceans, vol. 119, pp. 7509-7522, 2014. http://dx.doi.org/10.1002/2014JC010180
2. I. Joughin, B.E. Smith, and B. Medley, "Marine Ice Sheet Collapse Potentially Under Way for the Thwaites Glacier Basin, West Antarctica", Science, vol. 344, pp. 735-738, 2014. http://dx.doi.org/10.1126/science.1249055
3. W. Llovel, J.K. Willis, F.W. Landerer, and I. Fukumori, "Deep-ocean contribution to sea level and energy budget not detectable over the past decade", Nature Climate change, vol. 4, pp. 1031-1035, 2014. http://dx.doi.org/10.1038/nclimate2387
4. K.E. Trenberth, J.T. Fasullo, and M.A. Balmaseda, "Earth’s Energy Imbalance", Journal of Climate, vol. 27, pp. 3129-3144, 2014. http://dx.doi.org/10.1175/JCLI-D-13-00294.1
5. D.P. Chambers, and J.K. Willis, "Analysis of large-scale ocean bottom pressure variability in the North Pacific", J. Geophys. Res., vol. 113, 2008. http://dx.doi.org/10.1029/2008JC004930
6. J. Bamber, and R. Riva, "The sea level fingerprint of recent ice mass fluxes", The Cryosphere, vol. 4, pp. 621-627, 2010. http://dx.doi.org/10.5194/tc-4-621-2010
- See more at:
www.realclimate.org/index.php/archives/2015/01/diagnosing-causes-of-sea-level-rise
Nenhum comentário:
Postar um comentário