Do different climate models give different results? And if so, why?
The answer to these questions will increase our understanding of the
climate models, and potentially the physical phenomena and processes
present in the climate system.
We now have many different climate models, many different methods, and get a range of different results. They provide what we call ‘multi-model‘ and ‘multi-method‘ ensembles. But how do we make sense out of all this information?
And, do we really need all these different models? Global climate models tend to give roughly similar estimates for the climate sensitivity, but there is nevertheless a spread between the different model estimates. The models often diverge more radically if we zoom down to a region.
Furthermore, a single model may give different answers for the future temperature over North America, depending on which day is used to describe the weather at the starting point of the model simulation (Deser et al., 2012).
So the question is whether the differences in model set-up affect the range of the results, and whether a mix of models is superior to many simulations with a single model in terms of accounting for the unknowns of climate modelling.
The fuzziness associated with the spread between the model results is often referred to by the catch-all phrase ‘uncertainty‘, referring to (unpredictable) chaotic internal variations, vaguely known forcing estimates, and climate model limitation.
Whereas climate scientists find ‘uncertainty’ difficult, it plays a central role in statistics (Katz et al., 2013). The statisticians are experts at drawing knowledge from a large volume of information, incomplete data samples, and have methods for ‘distilling’ the data (using a phrase coined by Bruce Hewitson). Some interesting methods are regression analysis and factorial design.
It is necessary to bring on board more statisticians to participate on climate research. Hence, the motivation for a Statistics and Climate workshop with a high proportion of statisticians among the participants (supported by the SARMA network, Met Norway, Norwegian computing, and the Bjerknes centre).

Bringing together people from different fields can be challenging, and we sometimes realise that we speak about ‘uncertainty’ or ‘models’, but mean different things. Is ‘uncertainty’ a probability distribution, model error, gaps in observations, inaccuracy, or imprecision?
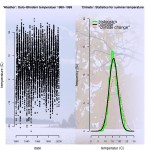
In statistics, a ‘model’ may be a probability distribution or an equation whose coefficients are estimated from the data (‘best-fit’). We can also define ‘weather’ as a time series describing when and how much, and ‘climate’ as a probability distribution saying something about how typical such an event is (illustration below).

During the workshop there were discussions about what is meant by ‘prediction‘ – is it the same as a ‘forecast‘? It is difficult to collaborate before we speak the same language and understand each other.
Sometimes it also may be useful to take a step back and re-examine concepts that we take for granted. It is interesting that the exact meaning of ‘storm‘ and ‘extreme‘ were topics of discussion at the workshop.
Our understanding of physics is needed to identify key scientific questions, but the statisticians have the expertise to design tests based on data and statistics. For instance, we can ask whether the model set-up has a systematic effect on the results of the simulation – as in the text above.
Another aspect is the question of proper sampling. It may be tempting to pick the ‘best’ model for a region, even though the same model performs poorly elsewhere. From a statistical point of view, however, we know that selective sampling will give spurious results, also referred to as a bias.
The Economist recently printed an article with the title ‘How science goes wrong‘, explaining how a bias arises when mostly positive results are reported in the medical literature. This is another form for selective sampling, and for the climate models, it can only be justified if there are physical reasons to exclude a particular model.
Another contribution from statisticians in climate research is to bring in their experience with ‘infographics’ (Spiegelhalter et al., 2011) and ways to convey complex messages through illustrations. This and the ability to make sense of data and model results are valuable for climate services.
We also need reliable data, but there is a concern about the quality (homogeneity) of some of the surface temperature (The International Surface Temperature Initiative ISTI). Resources are also needed for ‘data rescue‘, but it is difficult to find funding for such activity because it is often not regarded as ‘science’.
In addition to high-quality data, we need a common data structure for creating a platform for collaboration that includes observations and different kinds of products (e.g. empirical orthogonal functions), both in terms of data files on disks (e.g. netCDF and the ‘CF’ convention) and in the computer memory.
Standard conventions can reduce the risk of misrepresenting data and make the analysis more transparent. Advanced data structures also make better use of advanced facilities, e.g. the ‘S3′ method in R.
We now have many different climate models, many different methods, and get a range of different results. They provide what we call ‘multi-model‘ and ‘multi-method‘ ensembles. But how do we make sense out of all this information?
And, do we really need all these different models? Global climate models tend to give roughly similar estimates for the climate sensitivity, but there is nevertheless a spread between the different model estimates. The models often diverge more radically if we zoom down to a region.
Furthermore, a single model may give different answers for the future temperature over North America, depending on which day is used to describe the weather at the starting point of the model simulation (Deser et al., 2012).
So the question is whether the differences in model set-up affect the range of the results, and whether a mix of models is superior to many simulations with a single model in terms of accounting for the unknowns of climate modelling.
The fuzziness associated with the spread between the model results is often referred to by the catch-all phrase ‘uncertainty‘, referring to (unpredictable) chaotic internal variations, vaguely known forcing estimates, and climate model limitation.
Whereas climate scientists find ‘uncertainty’ difficult, it plays a central role in statistics (Katz et al., 2013). The statisticians are experts at drawing knowledge from a large volume of information, incomplete data samples, and have methods for ‘distilling’ the data (using a phrase coined by Bruce Hewitson). Some interesting methods are regression analysis and factorial design.
It is necessary to bring on board more statisticians to participate on climate research. Hence, the motivation for a Statistics and Climate workshop with a high proportion of statisticians among the participants (supported by the SARMA network, Met Norway, Norwegian computing, and the Bjerknes centre).

Bringing together people from different fields can be challenging, and we sometimes realise that we speak about ‘uncertainty’ or ‘models’, but mean different things. Is ‘uncertainty’ a probability distribution, model error, gaps in observations, inaccuracy, or imprecision?
In statistics, a ‘model’ may be a probability distribution or an equation whose coefficients are estimated from the data (‘best-fit’). We can also define ‘weather’ as a time series describing when and how much, and ‘climate’ as a probability distribution saying something about how typical such an event is (illustration below).

During the workshop there were discussions about what is meant by ‘prediction‘ – is it the same as a ‘forecast‘? It is difficult to collaborate before we speak the same language and understand each other.
Sometimes it also may be useful to take a step back and re-examine concepts that we take for granted. It is interesting that the exact meaning of ‘storm‘ and ‘extreme‘ were topics of discussion at the workshop.
Our understanding of physics is needed to identify key scientific questions, but the statisticians have the expertise to design tests based on data and statistics. For instance, we can ask whether the model set-up has a systematic effect on the results of the simulation – as in the text above.
Another aspect is the question of proper sampling. It may be tempting to pick the ‘best’ model for a region, even though the same model performs poorly elsewhere. From a statistical point of view, however, we know that selective sampling will give spurious results, also referred to as a bias.
The Economist recently printed an article with the title ‘How science goes wrong‘, explaining how a bias arises when mostly positive results are reported in the medical literature. This is another form for selective sampling, and for the climate models, it can only be justified if there are physical reasons to exclude a particular model.
Another contribution from statisticians in climate research is to bring in their experience with ‘infographics’ (Spiegelhalter et al., 2011) and ways to convey complex messages through illustrations. This and the ability to make sense of data and model results are valuable for climate services.
We also need reliable data, but there is a concern about the quality (homogeneity) of some of the surface temperature (The International Surface Temperature Initiative ISTI). Resources are also needed for ‘data rescue‘, but it is difficult to find funding for such activity because it is often not regarded as ‘science’.
In addition to high-quality data, we need a common data structure for creating a platform for collaboration that includes observations and different kinds of products (e.g. empirical orthogonal functions), both in terms of data files on disks (e.g. netCDF and the ‘CF’ convention) and in the computer memory.
Standard conventions can reduce the risk of misrepresenting data and make the analysis more transparent. Advanced data structures also make better use of advanced facilities, e.g. the ‘S3′ method in R.
References
- C. Deser, R. Knutti, S. Solomon, and A.S. Phillips, "Communication of the role of natural variability in future North American climate", Nature Climate Change, vol. 2, pp. 775-779, 2012. http://dx.doi.org/10.1038/nclimate1562
- R.W. Katz, P.F. Craigmile, P. Guttorp, M. Haran, B. Sansó, and M.L. Stein, "Uncertainty analysis in climate change assessments", Nature Climate Change, vol. 3, pp. 769-771, 2013. http://dx.doi.org/10.1038/nclimate1980
- D. Spiegelhalter, M. Pearson, and I. Short, "Visualizing Uncertainty About the Future", Science, vol. 333, pp. 1393-1400, 2011. http://dx.doi.org/10.1126/science.1191181
Nenhum comentário:
Postar um comentário