Em breve a UFRN estará oferecendo o curso de Bacharelado em Meteorologia. A previsão é que o curso iniciará no primeiro semestre de 2014. A proposta de criação do curso já foi aprovada no Conselho do Centro de Ciências Exatas e da Terra-CCET, e foi encaminhada para apreciação do Conselho de Ensino, Pesquisa e Extensão (CONSEPE) da Universidade. Após aprovação do curso em todas as instâncias superiores da UFRN, voltaremos a abordar o assunto com maiores detalhes.
quarta-feira, 16 de outubro de 2013


Sea level in the 5th IPCC report
What is happening to sea levels? That was perhaps the most controversial issue in the 4th IPCC report of 2007. The new report of the Intergovernmental Panel on Climate Change is out now, and here I will discuss what IPCC has to say about sea-level rise (as I did here after the 4th report).
Let us jump straight in with the following graph which nicely sums up the key findings about past and future sea-level rise: (1) global sea level is rising, (2) this rise has accelerated since pre-industrial times and (3) it will accelerate further in this century. The projections for the future are much higher and more credible than those in the 4th report but possibly still a bit conservative, as we will discuss in more detail below. For high emissions IPCC now predicts a global rise by 52-98 cm by the year 2100, which would threaten the survival of coastal cities and entire island nations. But even with aggressive emissions reductions, a rise by 28-61 cm is predicted. Even under this highly optimistic scenario we might see over half a meter of sea-level rise, with serious impacts on many coastal areas, including coastal erosion and a greatly increased risk of flooding.
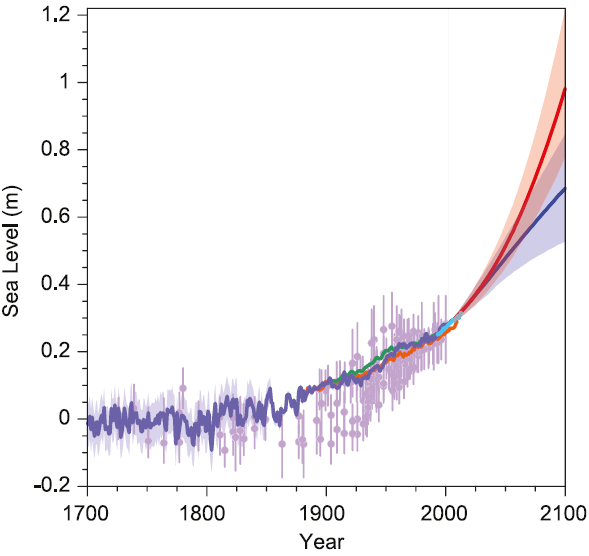
Fig. 1. Past and future sea-level rise. For the past, proxy data are shown in light purple and tide gauge data in blue. For the future, the IPCC projections for very high emissions (red, RCP8.5 scenario) and very low emissions (blue, RCP2.6 scenario) are shown. Source: IPCC AR5 Fig. 13.27.
In addition to the global rise IPCC extensively discusses regional differences, as shown for one scenario below. For reasons of brevity I will not discuss these further in this post.
By stefan @ 15 October 2013 -
Read more/Leia mais: realclimate
segunda-feira, 14 de outubro de 2013
Science of Climate Change online class starting next week on Coursera
Maybe you remember the rollout a few years ago of Open Climate 101,
a massive open online class (MOOC) that was served sort of free-range
from a computer at the University of Chicago. Now the class has been
entirely redone as Global Warming: The Science of Climate Change within the far slicker Coursera
platform. Beginning on October 21, the class is free and runs for 8
weeks. The videos have been reshot in a short and punchy (2-10 minute)
format, for example here (8:13). These seem like they will be easier to watch than traditional 45-minute lectures from a classroom. It’s based on, and will show you how to play with, all-new on-line computer models, including extensive new browsing systems for global climate records and model results from the new AR5 climate model archive, an ice sheet model you can clobber with slugs of CO2 as it evolves, and more. Come and watch the train wreck join the fun!
Course content
The class follows the general structure of Open Climate 101, based on the textbook Global Warming: Understanding the Forecast. This is class about science, but it is intended to be understandable by people without a strong science background.
Weeks 1-4 start from the very simplest model for the temperature of a planet, and build a picture of the complexity of the real climate system on Earth, with the greenhouse effect and climate feedbacks.
Weeks 5-6 consider the past and future carbon cycle.
Weeks 7-8 explain where we are and what can be done.
New On-line Climate Stuff
Coursera seems like a powerful medium for teaching any topic. But my class in particular is like no other Coursera class that I’ve heard of, in that it offers a suite of on-line interactive models that you can see here. They are always up and publicly available, so you teachers can throw students at them, no problem.
A time-series browser provides access to the GHCNM (NOAA link is currently shut down) global meteorological station monthly mean temperatures (7169 stations), and global glacier length records (472 records). These records can be compared with climate model results from the new AR5 model results, extracted from their grids. There are 12 different models and four scenarios, including Historical, HistoricalNat (natural-only), RCP2.6 (an optimistic ramping-down scenario), and RCP8.5 (less optimistic). This is a very open-ended system; my intent is to allow students to investigate a topic of their own devising, which they will write up and submit to grading by other students, a bit of Coursera wizardry.
An AR5 output mapper makes colored maps of output from climate models, including 3-D atmospheric temperature, specific humidity, cloud fraction, and 2-D fields of precipitation, soil moisture, runoff, leaf area index, and snow cover. These are monthly mean values from the Historical then RCP8.5 scenarios. The browser buffers the maps so that you can switch between them quickly, or show them in a slide show or movie. This is only a tiny fraction of the AR5 model respository, but it’s still enough data (about 130 GBytes) that serving this to a large MOOC audience is going to be a challenge.
The time-series browser and the map maker are both designed to be easily extended (by me, not by users). The system takes AR5 netcdf files directly as they download from the CMIP archive, and new climate records can be added to the time-series browser as simple csv format. Maybe realclimate readers or students in the class will have suggestions of what to add (I almost hate to ask!).
A new model for comparing the climate impacts of CO2 and CH4, called the Slugulator, lets you release slugs of either greenhouse gas and compare the antics that ensue. A favorite feature of mine is the comparison of the energy yield from fossil fuels, next to the total greenhouse energy trapped over the lifetimes of the gases.
And we have an interactive ice sheet model, you can clobber with slugs of CO2 (or just drag the temperature around) as it’s running. This comes from Frank Pattyn’s Excel-based GRANTISM, recoded as javascript by Martin O’Leary. I added the replay button and the CO2-clobbertron myself, however.
Plus there are retreads of the old favorites like Modtran, with which you can demonstrate the band saturation effect, Geocarb, which shows the long tail of fossil fuel CO2 in the atmosphere, and lots more.
Course content
The class follows the general structure of Open Climate 101, based on the textbook Global Warming: Understanding the Forecast. This is class about science, but it is intended to be understandable by people without a strong science background.
Weeks 1-4 start from the very simplest model for the temperature of a planet, and build a picture of the complexity of the real climate system on Earth, with the greenhouse effect and climate feedbacks.
Weeks 5-6 consider the past and future carbon cycle.
Weeks 7-8 explain where we are and what can be done.
New On-line Climate Stuff
Coursera seems like a powerful medium for teaching any topic. But my class in particular is like no other Coursera class that I’ve heard of, in that it offers a suite of on-line interactive models that you can see here. They are always up and publicly available, so you teachers can throw students at them, no problem.
A time-series browser provides access to the GHCNM (NOAA link is currently shut down) global meteorological station monthly mean temperatures (7169 stations), and global glacier length records (472 records). These records can be compared with climate model results from the new AR5 model results, extracted from their grids. There are 12 different models and four scenarios, including Historical, HistoricalNat (natural-only), RCP2.6 (an optimistic ramping-down scenario), and RCP8.5 (less optimistic). This is a very open-ended system; my intent is to allow students to investigate a topic of their own devising, which they will write up and submit to grading by other students, a bit of Coursera wizardry.
An AR5 output mapper makes colored maps of output from climate models, including 3-D atmospheric temperature, specific humidity, cloud fraction, and 2-D fields of precipitation, soil moisture, runoff, leaf area index, and snow cover. These are monthly mean values from the Historical then RCP8.5 scenarios. The browser buffers the maps so that you can switch between them quickly, or show them in a slide show or movie. This is only a tiny fraction of the AR5 model respository, but it’s still enough data (about 130 GBytes) that serving this to a large MOOC audience is going to be a challenge.
The time-series browser and the map maker are both designed to be easily extended (by me, not by users). The system takes AR5 netcdf files directly as they download from the CMIP archive, and new climate records can be added to the time-series browser as simple csv format. Maybe realclimate readers or students in the class will have suggestions of what to add (I almost hate to ask!).
A new model for comparing the climate impacts of CO2 and CH4, called the Slugulator, lets you release slugs of either greenhouse gas and compare the antics that ensue. A favorite feature of mine is the comparison of the energy yield from fossil fuels, next to the total greenhouse energy trapped over the lifetimes of the gases.
And we have an interactive ice sheet model, you can clobber with slugs of CO2 (or just drag the temperature around) as it’s running. This comes from Frank Pattyn’s Excel-based GRANTISM, recoded as javascript by Martin O’Leary. I added the replay button and the CO2-clobbertron myself, however.
Plus there are retreads of the old favorites like Modtran, with which you can demonstrate the band saturation effect, Geocarb, which shows the long tail of fossil fuel CO2 in the atmosphere, and lots more.
IGAC - iCACGP 2014: First announcement

On behalf of the Local Organizing Committee, we invite
you to participate in the joint 13th iCACGP
Quadrennial Symposium and 13th IGAC Science
Conference, which is to be held from the 22nd
- 26th of September, 2014, in the city of Natal, in
northeastern Brazil.
Registration
is now open.
The Joint Quadrennial ICACGP Symposia
and IGAC Science Conferences provide unique mechanisms
for the dissemination of scientific information across
the transdisciplinary global atmospheric scientific
community. The topical theme of the joint 13th
Quadrennial iCACGP Symposium / 13th IGAC
Science Conference is "Changing
Chemistry in a Changing World": The foci
being our current knowledge and understanding of the
chemical, physical and biogeochemical processes, which
determine atmospheric composition and behavior, their
modification by anthropogenic activity and related
feedbacks. Of central significance to the meeting is
our knowledge of the fundamental science, which
impacts the accuracy of our assessment of both the
recent and current impact of human behavior on the
earth system, and of the prediction of future air
quality, human health, environmental and climate
change.
The joint 13th iCACGP / 13th IGAC Quadrennial Symposium/Conference takes place over five days from the 22nd - 26th of September, 2014. It comprises plenary sessions, which begin with invited keynote speakers and have selected topical oral presentations, coupled with innovative and high quality poster sessions. The latter are the key integrating aspect. Posters will be displayed continuously throughout the meeting. The Symposium/Conference also features an excellent Young Scientist Program. Finally, this joint 13th Quadrennial iCACGP Symposium /13th IGAC Science Conference also celebrates the 25th Anniversary of the World Meteorological Organization´s (WMO) Global Atmosphere Watch (GAW) addressing the issues of both operational and academic research.
We look forward to welcoming you all to iCACGP/IGAC-2014 in Natal, Brazil.
Please find more details on the venue, accommodation, conference programme, registration details and deadlines, as well as useful information for tourists by browsing through our website: http://igac-icacgp2014.org/.
The joint 13th iCACGP / 13th IGAC Quadrennial Symposium/Conference takes place over five days from the 22nd - 26th of September, 2014. It comprises plenary sessions, which begin with invited keynote speakers and have selected topical oral presentations, coupled with innovative and high quality poster sessions. The latter are the key integrating aspect. Posters will be displayed continuously throughout the meeting. The Symposium/Conference also features an excellent Young Scientist Program. Finally, this joint 13th Quadrennial iCACGP Symposium /13th IGAC Science Conference also celebrates the 25th Anniversary of the World Meteorological Organization´s (WMO) Global Atmosphere Watch (GAW) addressing the issues of both operational and academic research.
We look forward to welcoming you all to iCACGP/IGAC-2014 in Natal, Brazil.
Please find more details on the venue, accommodation, conference programme, registration details and deadlines, as well as useful information for tourists by browsing through our website: http://igac-icacgp2014.org/.
The international Commission on Atmospheric Chemistry
and Global Pollution, iCACGP, is one of ten
Commissions in International Association of
Meteorology and Atmospheric Sciences, IAMAS, which in
turn is one of the associations within International
Union of Geodesy and Geophysics, IUGG, coordinated by
International Council for Science, ICSU. iCACGP was
created in 1957 to focus on the multidisciplinary
scientific issues associated with radiation and
pollution. The International Global Atmospheric
Chemistry (IGAC) project was formed in 1990 to address
growing international concern over rapid changes
observed in the Earth´s atmosphere. IGAC is a Core
Project under the umbrella of the International
Geosphere Biosphere Programme (IGBP) and co-sponsored
by the international Commission on Atmospheric
Composition and Global Pollution (iCACGP). Since 1994
the Quadrennial iCACGP Symposium has been held jointly
with the IGAC Science Conference: A focused IGAC
conference also taking place between joint
conferences. This series of scientific meeting
provides a unique forum for research scientists and
graduate students and state of the art knowledge
transfer for professionals active in the area of
atmospheric chemistry around the world.
Please circulate this announcement to
relevant email lists / contacts.
domingo, 13 de outubro de 2013
Seca no Semiárido nordestino é a pior em 30 anos
Ana Cristina Campos
Da Agência Brasi, via portal UOL
Para garantir o abastecimento para as pessoas, a ANA restringe o uso da água para atividades produtivas como a irrigação e a piscicultura.
A agência acompanha a situação 45 açudes e seis rios de domínio federal no Semiárido. Do total, em 16 açudes e três rios são obedecidas as regras da ANA, abrangendo 91 municípios e cerca de 1,9 milhão de pessoas.
Desde a semana passada, nas cidades de Coremas, Pombal, Cajazeirinhas, Paulista e São Bento, na Paraíba, e Jardim Piranhas e Jucurutu, no Rio Grande do Norte, a água só pode ser retirada do rio e dos açudes para qualquer atividade produtiva três vezes por semana das 2h às 11h.
A recomendação da ANA é que não seja feita irrigação entre as 11h e as 17h, pois, nesse período, muita água é perdida por evaporação. A agência também alerta para que nenhum novo tipo de cultura seja iniciado neste momento devido à possibilidade de não haver água suficiente.
"A prioridade de uso dos açudes é para abastecimento humano e consumo animal. É muito importante que os agricultores implementem tecnologias de uso eficiente da água. Não se pode ter no semiárido irrigação por inundação", disse o superintendente.
Segundo ele, a ANA monitora constantemente o nível da água para acompanhar o cumprimento das medidas.
De acordo com o Ministério da Integração Nacional, o governo federal investe mais de R$ 16 bilhões para reduzir os efeitos da seca e amenizar as perdas econômicas, por meio de ações emergenciais, obras estruturantes e linhas especiais de crédito.
Segundo o ministério, desde janeiro de 2012, o governo destinou R$ 916 milhões para a Operação Carro-Pipa. Sob a coordenação do Exército, foram contratados 5.809 carros-pipa para levar água a mais de 3,8 milhões de pessoas em 815 municípios.
Ainda de acordo com a pasta, o Programa Água para Todos entregou 370 mil cisternas e a meta é construir mais 750 mil até 2014. Além disso, o programa prevê a implantação de sistemas simplificados de abastecimento de água para comunidades rurais de baixa renda.
O ministério informou que o Bolsa Estiagem é pago a mais de 1,1 mil pessoas em 1.378 municípios, com a transferência de mais de R$ 1 bilhão. O pagamento de R$ 80 é destinado a agricultores de baixa renda que vivem em cidades atingidas pela seca.
Assim, as chuvas têm sido bem abaixo da média no Nordeste há três anos. Segundo ele, ainda é cedo para dizer se a região nordestina terá mais chuvas em 2014.
Da Agência Brasi, via portal UOL
Seca no Semiárido nordestino é a pior em 30 anos, segundo governo
A seca que afeta o semiárido nordestino desde 2011 deixou metade dos 504 reservatórios monitorados pela Agência Nacional de Águas (ANA) com menos de 30% da capacidade de armazenamento de água. "Esta é a pior seca nos últimos 30 anos. Se não tivermos um período de chuvas de janeiro a maio em 2014, para recuperar os reservatórios, a situação ficará gravíssima", disse o superintendente de Regulação da ANA, Rodrigo Flecha Ferreira Alves.Para garantir o abastecimento para as pessoas, a ANA restringe o uso da água para atividades produtivas como a irrigação e a piscicultura.
A agência acompanha a situação 45 açudes e seis rios de domínio federal no Semiárido. Do total, em 16 açudes e três rios são obedecidas as regras da ANA, abrangendo 91 municípios e cerca de 1,9 milhão de pessoas.
Prioridade é abastecimento humano e consumo animal
A restrição de uso mais recente foi determinada na segunda-feira (7) para o Rio Piranhas-Açu, que corta a Paraíba e o Rio Grande do Norte, e para os açudes de Coremas e Mãe D'Água, ambos na Paraíba, que estão com 34% e 33% da capacidade de armazenamento de água, respectivamente.Desde a semana passada, nas cidades de Coremas, Pombal, Cajazeirinhas, Paulista e São Bento, na Paraíba, e Jardim Piranhas e Jucurutu, no Rio Grande do Norte, a água só pode ser retirada do rio e dos açudes para qualquer atividade produtiva três vezes por semana das 2h às 11h.
A recomendação da ANA é que não seja feita irrigação entre as 11h e as 17h, pois, nesse período, muita água é perdida por evaporação. A agência também alerta para que nenhum novo tipo de cultura seja iniciado neste momento devido à possibilidade de não haver água suficiente.
"A prioridade de uso dos açudes é para abastecimento humano e consumo animal. É muito importante que os agricultores implementem tecnologias de uso eficiente da água. Não se pode ter no semiárido irrigação por inundação", disse o superintendente.
Segundo ele, a ANA monitora constantemente o nível da água para acompanhar o cumprimento das medidas.
Nordeste e norte de Minas: 1.484 municípios em situação de emergência
A Secretaria Nacional de Defesa Civil reconhece que 1.484 municípios nordestinos e do norte de Minas Gerais estão em situação de emergência por causa da estiagem, afetando 10,67 milhões de pessoas.De acordo com o Ministério da Integração Nacional, o governo federal investe mais de R$ 16 bilhões para reduzir os efeitos da seca e amenizar as perdas econômicas, por meio de ações emergenciais, obras estruturantes e linhas especiais de crédito.
Segundo o ministério, desde janeiro de 2012, o governo destinou R$ 916 milhões para a Operação Carro-Pipa. Sob a coordenação do Exército, foram contratados 5.809 carros-pipa para levar água a mais de 3,8 milhões de pessoas em 815 municípios.
Ainda de acordo com a pasta, o Programa Água para Todos entregou 370 mil cisternas e a meta é construir mais 750 mil até 2014. Além disso, o programa prevê a implantação de sistemas simplificados de abastecimento de água para comunidades rurais de baixa renda.
O ministério informou que o Bolsa Estiagem é pago a mais de 1,1 mil pessoas em 1.378 municípios, com a transferência de mais de R$ 1 bilhão. O pagamento de R$ 80 é destinado a agricultores de baixa renda que vivem em cidades atingidas pela seca.
Quantidade de chuva para 2014 ainda é incerta
O meteorologista Mozar de Araújo Salvador, do Instituto Nacional de Meteorologia, explicou que a seca iniciada em 2011 ocorre por causa do Dipolo Positivo do Atlântico, fenômeno oceânico que interfere no clima do semiárido ao deslocar a formação de nuvens para o norte da Linha do Equador, aumentando a precipitação no Oceano Atlântico.Assim, as chuvas têm sido bem abaixo da média no Nordeste há três anos. Segundo ele, ainda é cedo para dizer se a região nordestina terá mais chuvas em 2014.
sexta-feira, 11 de outubro de 2013
Em meio à seca, rebanho do RN perdeu 190 mil cabeças de gado
Andrielle Mendes - repórter, para TN Online
O Rio Grande do Norte registrou a terceira maior queda do país no rebanho bovino entre 2011 e 2012, em termos percentuais. A redução (18,1%), que foi menor apenas que as verificadas na Paraíba (28,6%) e em Pernambuco (24,2%), pode ser maior, já que as perdas de 2013 não foram contabilizadas. Os números fazem parte da pesquisa Municipal da Pecuária, divulgada ontem pelo Instituto Brasileiro de Geografia e Estatística (IBGE), e foram comentados por representantes do setor e do governo durante o lançamento da programação da Festa do Boi, no Parque Aristófanes Fernandes, em Parnamirim.
O IBGE não estimou o prejuízo financeiro ocasionado pela queda no número de bovinos no RN. Houve, no entanto, um prejuízo de R$ 15,4 milhões, considerando apenas a redução da produção de leite e mel no estado. Segundo a pesquisa, 45 mil vacas deixaram de ser ordenhadas e 45 milhões de litros de leite deixaram de ser produzidos no estado entre 2011 e 2012. A queda na produção de leite (18,6%) só foi menor que a da Paraíba (39,9%) e a de Pernambuco (36,1%), no país.
“A seca prolongada resultou na redução de muitos ‘plantéis’ (rebanho), sobretudo o de bovinos, causando impactos sobre a produção e produtividade de leite”, analisou o IBGE, no estudo.
A redução do rebanho no RN foi quase 18 vezes maior que a do país e quatro vezes maior que a do Nordeste no período. Nos últimos dois anos, 190 mil bovinos morreram ou foram vendidos para o abate, em função da seca, de um total de 1 milhão de cabeças no RN.
Segundo o IBGE, os produtores enfrentaram ainda aumento nos custos dos principais insumos de produção, como produtos veterinários, e dificuldades para comprar milho e soja – principais componentes das rações.
2013
A situação em 2013, observa Tarcísio Bezerra, secretário de Agricultura do estado, não é muito diferente. O número de cabeças de gado e a produção de leite, segundo ele, deverão continuar caindo no estado, mas num ritmo menor. Ele estima mudanças só em 2014, quando voltar a chover.
Embora acredite que as piores perdas já tenham passado, Bezerra observa que o cenário no estado continua preocupante. “Cerca de 140 dos 167 municípios do RN estão sendo abastecidos por carros-pipa. Há pelo menos mil comunidades sem água no estado e 20 açudes entrando em colapso. O desafio não é só garantir água para o rebanho, mas garantir água também para o consumo humano em muitas localidades”, afirmou.
Medidas, segundo ele, estão sendo tomadas para evitar perdas maiores. “Já distribuímos 40 mil sacas de ‘torta’ – alimento para o gado – até o momento. Vamos distribuir mais 75 mil até o final do ano e 180 mil até março de 2014. O Estado também tem solicitado ao governo federal e aos bancos públicos que flexibilizem a concessão de crédito para os produtores rurais”, disse.
Marcos Aurélio de Sá, presidente da Associação Norte-Riograndense dos Criadores (Anorc), estima que as perdas do setor sejam maiores que as registradas pelo IBGE. “Acredito que perdemos cerca de 30% do rebanho. As perdas serviram para mostrar aos produtores que é preciso se preparar para secas como essa”, disse.
A queda na produção, observa Elder de Oliveira Costa, supervisor de estatísticas agropecuárias do IBGE/RN, afeta a economia como um todo. “O produtor fica descapitalizado, menos dinheiro circula na economia, e o consumo cai nos municípios”.

O Rio Grande do Norte registrou a terceira maior queda do país no rebanho bovino entre 2011 e 2012, em termos percentuais. A redução (18,1%), que foi menor apenas que as verificadas na Paraíba (28,6%) e em Pernambuco (24,2%), pode ser maior, já que as perdas de 2013 não foram contabilizadas. Os números fazem parte da pesquisa Municipal da Pecuária, divulgada ontem pelo Instituto Brasileiro de Geografia e Estatística (IBGE), e foram comentados por representantes do setor e do governo durante o lançamento da programação da Festa do Boi, no Parque Aristófanes Fernandes, em Parnamirim.
Magnus Nascimento Perdas calculadas pelo IBGE computam animais mortos e também os que foram vendidos pelos criadores para abate, por exemplo
Perdas calculadas pelo IBGE computam animais mortos e também os que foram vendidos pelos criadores para abate, por exemploO IBGE não estimou o prejuízo financeiro ocasionado pela queda no número de bovinos no RN. Houve, no entanto, um prejuízo de R$ 15,4 milhões, considerando apenas a redução da produção de leite e mel no estado. Segundo a pesquisa, 45 mil vacas deixaram de ser ordenhadas e 45 milhões de litros de leite deixaram de ser produzidos no estado entre 2011 e 2012. A queda na produção de leite (18,6%) só foi menor que a da Paraíba (39,9%) e a de Pernambuco (36,1%), no país.
“A seca prolongada resultou na redução de muitos ‘plantéis’ (rebanho), sobretudo o de bovinos, causando impactos sobre a produção e produtividade de leite”, analisou o IBGE, no estudo.
A redução do rebanho no RN foi quase 18 vezes maior que a do país e quatro vezes maior que a do Nordeste no período. Nos últimos dois anos, 190 mil bovinos morreram ou foram vendidos para o abate, em função da seca, de um total de 1 milhão de cabeças no RN.
Segundo o IBGE, os produtores enfrentaram ainda aumento nos custos dos principais insumos de produção, como produtos veterinários, e dificuldades para comprar milho e soja – principais componentes das rações.
2013
A situação em 2013, observa Tarcísio Bezerra, secretário de Agricultura do estado, não é muito diferente. O número de cabeças de gado e a produção de leite, segundo ele, deverão continuar caindo no estado, mas num ritmo menor. Ele estima mudanças só em 2014, quando voltar a chover.
Embora acredite que as piores perdas já tenham passado, Bezerra observa que o cenário no estado continua preocupante. “Cerca de 140 dos 167 municípios do RN estão sendo abastecidos por carros-pipa. Há pelo menos mil comunidades sem água no estado e 20 açudes entrando em colapso. O desafio não é só garantir água para o rebanho, mas garantir água também para o consumo humano em muitas localidades”, afirmou.
Medidas, segundo ele, estão sendo tomadas para evitar perdas maiores. “Já distribuímos 40 mil sacas de ‘torta’ – alimento para o gado – até o momento. Vamos distribuir mais 75 mil até o final do ano e 180 mil até março de 2014. O Estado também tem solicitado ao governo federal e aos bancos públicos que flexibilizem a concessão de crédito para os produtores rurais”, disse.
Marcos Aurélio de Sá, presidente da Associação Norte-Riograndense dos Criadores (Anorc), estima que as perdas do setor sejam maiores que as registradas pelo IBGE. “Acredito que perdemos cerca de 30% do rebanho. As perdas serviram para mostrar aos produtores que é preciso se preparar para secas como essa”, disse.
A queda na produção, observa Elder de Oliveira Costa, supervisor de estatísticas agropecuárias do IBGE/RN, afeta a economia como um todo. “O produtor fica descapitalizado, menos dinheiro circula na economia, e o consumo cai nos municípios”.
The IPCC AR5 attribution statement
Last year I discussed the basis of the AR4 attribution statement:
Most of the observed increase in global average temperatures since the mid-20th century is very likely due to the observed increase in anthropogenic greenhouse gas concentrations.
In the new AR5 SPM (pdf), there is an analogous statement:
It is extremely likely that more than half of the observed increase in global average surface temperature from 1951 to 2010 was caused by the anthropogenic increase in greenhouse gas concentrations and other anthropogenic forcings together. The best estimate of the human-induced contribution to warming is similar to the observed warming over this period.
This includes differences in the likelihood statement, drivers and a new statement on the most likely amount of anthropogenic warming.
It is useful to remind ourselves that these statements are addressing our confidence in the characterisation of the anthropogenic contribution to the global surface temperature trend since the middle of the 20th Century. This contribution is unavoidably represented by a distribution of values because of the uncertainties associated with forcings, responses and internal variability. The AR4 statement confined itself to quantifying the probability that the greenhouse-gas driven trend was less than half the total trend as being less than 10% (or alternately, that at least 90% of the distribution was above 50% based on the IPCC definition of “very likely”):

Figure 1: Two schematic distributions of possible ‘anthropogenic contributions’ to the warming over the last 50 years. Note that in each case, despite a difference in the mean and variance, the probability of being below 50, is exactly 0.1 (i.e. a 10% likelihood).
In AR5, there are two notable changes to this. First, the likelihood level is now at least 95%, and so the assessment is for less than 5% probability of the trend being less than half of the observed trend. Secondly, they have switched from the ‘anthropogenic greenhouse gas” driven trend, to the total anthropogenic trend. As I discussed last time, the GHG trend is almost certainly larger than the net anthropogenic trend because of the high likelihood that anthropogenic aerosols have been a net cooling over that time. Both changes lead to a stronger statement than in AR4. One change in language is neutral; moving from “most” to “more than half”, but this was presumably to simply clarify the definition.
The second part of the AR5 statement is interesting as well. In the AR4 SPM, IPCC did not give a ‘best estimate’ for the anthropogenic contribution (though again many people were confused on this point). This time they have characterised the best estimate as being close to the observed estimate – i.e. that the anthropogenic trend is around 100% of the observed trend, implying that the best estimates of net natural forcings and internal variability are close to zero. This is equivalent to placing the peak in the distribution in the above figure near 100%.
The basis for these changes is explored in Chapter 10 on detection and attribution and is summarised in the following figure (10.5):
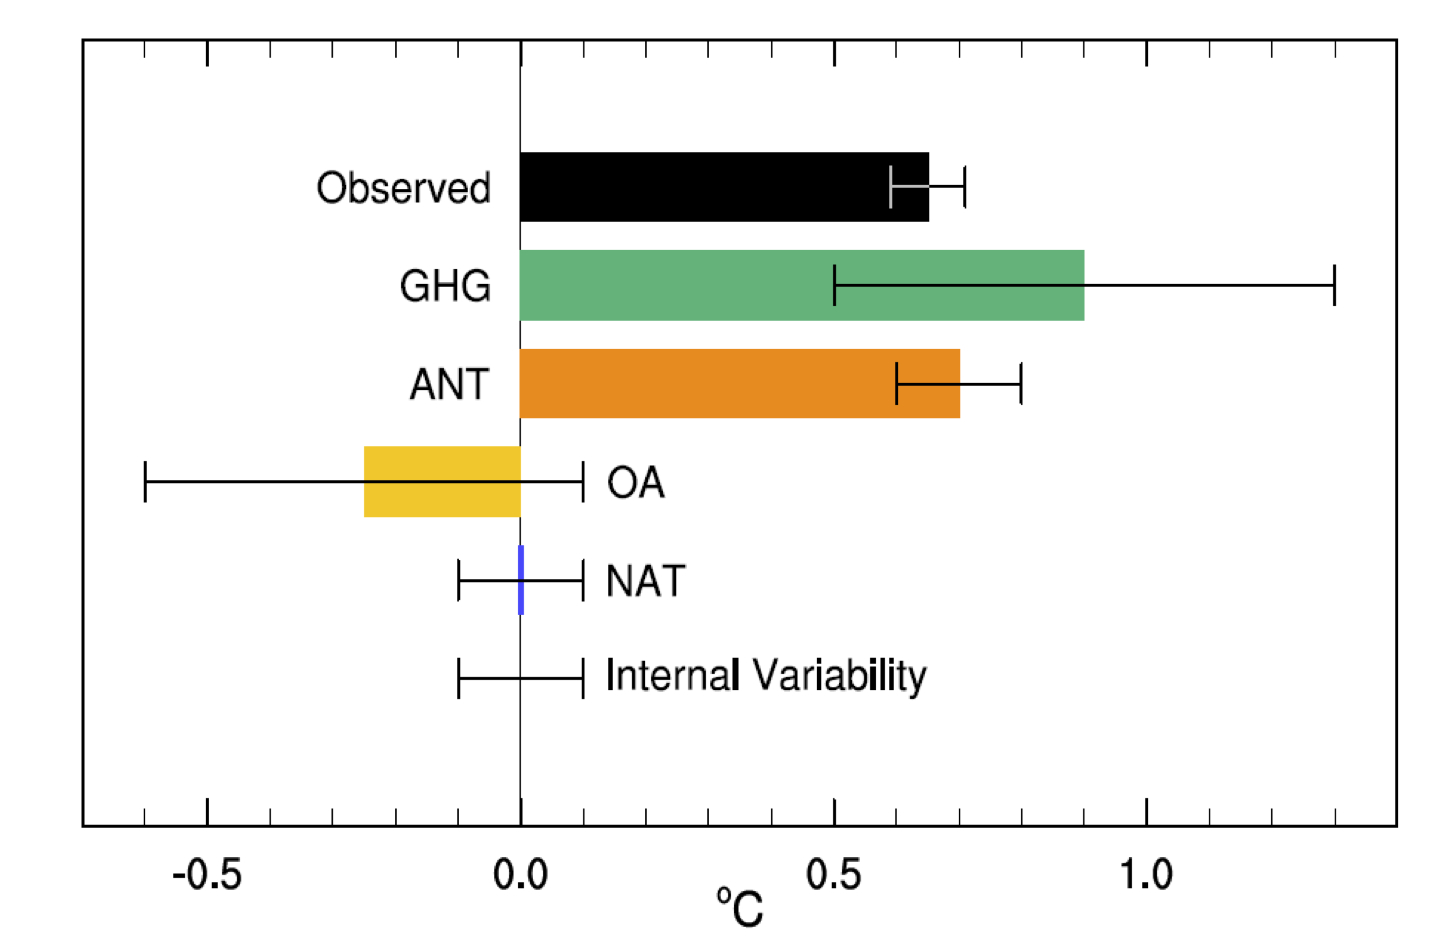
Figure 2. Assessed likely ranges (whiskers) and their mid-points (bars) for attributable warming trends over the 1951–2010 period due to well-mixed greenhouse gases (GHG), other anthropogenic forings (OA), natural forcings (NAT), combined anthropogenic forcings (ANT), and internal variability. The HadCRUT4 observations are shown in black with the 5–95% uncertainty range due to observational uncertainty.
These estimates are the “assessed” trends that come out of fingerprint studies of the temperature changes and account for potential mis-estimates (over or under) of internal variability, sensitivity etc. in the models (and potentially the forcings). The raw material are the model hindcasts of the historical period – using all forcings, just the natural ones, just the anthropogenic ones and various variations on that theme.
The error bars cover the ‘likely’ range (33-66%), so are close to being ±1 standard deviation (except for the observations (5-95%), which is closer to ±2 standard deviations). It is easy enough to see that the ‘ANT’ row (the combination from all anthropogenic forcings) is around 0.7 ± 0.1ºC, and the OBS are 0.65 ± 0.06ºC. If you work that through (assuming normal distributions for the uncertainties), it implies that the probability of the ANT trend being less than half the OBS trend is less than 0.02% – much less than the stated 5% level. The difference is that the less confident statement also takes into account structural uncertainties about the methodology, models and data. Similarly, the best estimate of the ratio of ANT to OBS has a 2 sd range between 0.8 and 1.4 (peak at 1.08). Consistent with this are the rows for natural forcing and internal variability – neither are significantly different to zero in the mean, and the uncertainties are too small for them to explain the observed trend with any confidence. Note that the ANT vs. NAT comparison is independent of the GHG or OA comparisons; the error bars for ANT do not derive from combining the GHG and OA results.
It is worth asking what the higher confidence/lower error bars are associated with. First, the longer time period (an extra 5 years) makes the trends clearer relative to the noise, multiple methodologies have been used which get the same result, and fingerprints have been better constrained by the greater use of spatial information. Small effects may also arise from better characterisations of the uncertainties in the observations (i.e. in moving from HadCRUT3 toHadCRUT4). Because of the similarity of patterns related to aerosols and greenhouse gases, there is more uncertainty in doing the separate attributions rather than looking at anthropogenic forcings collectively. Interestingly, the attribution of most of the trend to GHGs alone would still remain very likely (as in AR4); I estimate a roughly 7% probability that it would account for less than half the OBS trend. A factor that might be relevant (though I would need to confirm this) is that more CMIP5 simulations from a wider range of models were available for the NAT/ANT comparison than previously in CMIP3/4.
It could be argued that since recent trends have fallen slightly below the multi-model ensemble mean, this should imply that our uncertainty has massively increased and hence the confidence statement should be weaker than stated. However this doesn’t really follow. Over-estimates of model sensitivity would be accounted for in the methodology (via a scaling factor of less than one), and indeed, a small over-estimate (by about 10%) is already factored in. Mis-specification of post-2000 forcings (underestimated volcanoes, Chinese aerosols or overestimated solar), or indeed, uncertainties in all forcings in the earlier period, leads to reduced confidence in attribution in the fingerprint studies, and an lower estimate of the anthropogenic contribution. Finally, if the issue is related simply to an random realisation of El Niño/La Niña phases or other sources of internal variability, this simply feeds into the ‘Internal variability’ assessment. Thus the effects of recent years are already embedded within the calculation, and will have led to a reduced confidencecompared to a situation where things lined up more. Using this as an additional factor to change the confidence rating again would be double counting.
There is more information on this process in the IPCC chapter itself, and in the referenced literature (particularly Ribes and Terray (2013), Jones et al (2013) and Gillet et al (2013)). There is also a summary of relevant recent papers at SkepticalScience.
Bottom line? These statements are both comprehensible and traceable back to the literature and the data. While they are conclusive, they are not a dramatic departure from basic conclusions of AR4 and subsequent literature – but then, that is exactly what one should expect.
quarta-feira, 9 de outubro de 2013
UFRN: Escola de Ciências e Tecnologia discute pesquisas na Antártica
A Escola de Ciências e Tecnologia (ECT)
da Universidade Federal do Rio Grande do Norte realiza o Colóquio “Do
gelo na Terra do Fogo ao fogo na Terra do Gelo” sobre o panorama das
pesquisas espaciais brasileiras na Antártica nesta sexta-feira, 11, das
16h50 às 18h30, na sala 4 da ECT.
O palestrante será José Henrique
Fernandez, professor da UFRN, pesquisador e participante de mais de 15
missões antárticas, que irá esclarecer questões como o que aconteceria
se todo o gelo antártico derretesse, a relação da Antártica com o Brasil
e como o Brasil entrou para o Tratado da Antártica.
O Colóquio pretende fazer uma revista
nos mais de 30 anos de pesquisas brasileiras no Continente Branco,
especialmente das investigações na área espacial, com destaque para os
projetos desenvolvidos no Instituto Nacional de Pesquisas Espaciais
(INPE), retratando o pioneirismo dos primeiros desbravadores até o
incêndio que destruiu a Estação Antártica Comandante Ferraz em fevereiro
de 2012.
Fonte: AGECOM-UFRN
terça-feira, 8 de outubro de 2013
Agricultores querem soluções emergenciais que amenizem efeitos da seca no RN
Para amenizarem os problemas causados pela
seca no semiárido é preciso que haja soluções emergenciais e outras a
médio e longo prazos. Essa foi a constatação central após as exposições
de debate em torno do tema “Os Efeitos da Seca e as Medidas de
Convivência com o Fenômeno”, na audiência pública realizada que começou à
tarde e só terminou depois das 9h da noite desta segunda feira (7) na
Assembleia Legislativa, numa proposição do deputado Fábio Dantas
(PCdoB).
Ao final dos debates, Fábio Dantas anunciou que nesta terça feira, encaminhará ao presidente da Assembleia Legislativa, deputado Ricardo Motta (PROS) a solicitação para a criação de uma comissão permanente na Casa para acompanhar o problema da seca no Estado.
Algumas tecnologias sociais foram colocadas como soluções para a convivência com os efeitos da seca no Rio Grande do Norte, tendo como base a descentralização da água. Entre elas estão a estocagem da água, produção de forragem, perfuração e instalação de poços e a construção de barragens submersas, barragens sucessivas e barreiros trincheiras.
A audiência pública, que foi bastante concorrida, contou com a presença dos deputados Ricardo Motta, Fernando Mineiro (PT), Getúlio Rêgo (DEM), Gustavo Fernandes (PMDB), Antônio Jácome (PMN), Hermano Morais (PMDB) e Tomba Farias (PSD).
O secretário de Agricultura do Estado, Tarcísio Dantas disse que o governo está profundamente empenhado em encontrar soluções para o enfrentamento dos efeitos da seca. “Não é por falta de tecnologia que isso não acontece. O que não existe é uma política nacional permanente de crédito agrícola para o semiárido. Sem uma solução definitiva vamos permanecer na penúria”, afirmou.
Ao final dos debates, Fábio Dantas anunciou que nesta terça feira, encaminhará ao presidente da Assembleia Legislativa, deputado Ricardo Motta (PROS) a solicitação para a criação de uma comissão permanente na Casa para acompanhar o problema da seca no Estado.
Algumas tecnologias sociais foram colocadas como soluções para a convivência com os efeitos da seca no Rio Grande do Norte, tendo como base a descentralização da água. Entre elas estão a estocagem da água, produção de forragem, perfuração e instalação de poços e a construção de barragens submersas, barragens sucessivas e barreiros trincheiras.
A audiência pública, que foi bastante concorrida, contou com a presença dos deputados Ricardo Motta, Fernando Mineiro (PT), Getúlio Rêgo (DEM), Gustavo Fernandes (PMDB), Antônio Jácome (PMN), Hermano Morais (PMDB) e Tomba Farias (PSD).
O secretário de Agricultura do Estado, Tarcísio Dantas disse que o governo está profundamente empenhado em encontrar soluções para o enfrentamento dos efeitos da seca. “Não é por falta de tecnologia que isso não acontece. O que não existe é uma política nacional permanente de crédito agrícola para o semiárido. Sem uma solução definitiva vamos permanecer na penúria”, afirmou.
No entanto, as reclamações foram generalizadas pelos representantes dos sindicatos de trabalhadores rurais e de pequenos e médio proprietários que participaram dos debates. Segundo eles, não há planejamento e as providências anunciadas pelo governo não chegam ao campo.
A representante do Grito da Seca, Joana D`arc Pires afirmou que é preciso viver no semiárido, mas faltam políticas públicas permanentes para a convivência com os efeitos da seca. “As providências precisam sair dos gabinetes, sair do papel”, asseverou.
“Se o campo não produz, a cidade não come. A Emater está fechada para balanço. Estamos pedindo da Assembleia que corrija isso”, afirmou Cristino Jerônimo, do Sindicato dos Trabalhadores Rurais de Caicó.
Em sua participação, o deputado Ricardo Motta que em momento algum a Assembleia ficará omissa e o “que for deliberado nesta audiência, com certeza levaremos ao plenário da nossa Casa e aí poderemos cobrar ações concreta do governo do Estado e também do governo federal por meio da nossa bancada”.
A representante do Ministério Público nos debates, Promotora de Justiça Gerliana Araújo Rocha propôs à Mesa dos trabalhos que solicite do governo do Estado, por escrito, as soluções imediatas e de médio e longo prazos para minimizarem os efeitos provocados pela seca.
Os pecuaristas reclamaram muito da falta de compromisso do governo com o Programa do Leite que está com cinco quinzenas em atraso no pagamento aos fornecedores.
Fonte: Senadinho Macaíba
Semana de Eletroquímica Ambiental
Convidamos
todos a participar da 1ª Semana de Eletroquímica do IQ-UFRN, cuja
programação consta no folder que encaminhamos anexado a esta mensagem.
O
objetivo deste evento será apresentar os avanços alcançados na área de eletroquímica
ambiental, referentes a tratamento de águas residuais, produção de agentes
desinfectantes, cloração eletroquímica, técnicas emergentes (eletro-fenton e
foto-eletrofenton) para tratamento de efluentes industriais e domésticos,
desenvolvimento de sensores para detecção e quantificação de poluentes, avanços
em eletrocatalisadores para células combustíveis, aplicação da tecnologia
eletroquímica para tratamento de água produzida derivada da indústria do
petróleo, e outros temas.
O evento
contará com a presença de professores/pesquisadores (Nacionais e
internacionais), estudantes de graduação, pós-graduação, profissionais da área
de eletroquímica e afins.
Por
favor, divulgar para os alunos e demais interessados,
Atenciosamente,
Prof. Carlos Alberto Martinez Huitle
Assinar:
Postagens (Atom)